This resource includes a step by step guide, model diagrams and excel template:
- Digital Marketing Measurement Dashboards in Perspective
- Setting Primary Objectives
- Setting Primary Objectives as GA4 Key Events
- Connecting Primary Objectives to Business Objectives
- Digital Channels Driving Primary Objectives
- Understanding How Digital Channels Contribute
- Gap Correlation
- Channel Mic, Tactics Iteration and Testing
- Conclusions
This post outlines a tried and tested framework for planning and implementing a digital marketing measurement framework that can help with planning and understanding the effectiveness of a digital strategy.

The Digital Marketing Measurement Dashboard That We’ll Develop in This Post
Digital Marketing Dashboards in Perspective
One of the greatest and most commonly made mistakes in digital marketing, is not setting campaign objectives that can be effectively measured. The next most common mistake is not setting objectives that can easily be connected back to business objectives. This means we cannot judge the success of our campaigns and therefore it becomes impossible to calculate ROI and justify our digital marketing budgets.
The following measurement dashboard can be used to help shape and deliver our digital strategy as well as helping to plan and measure tactical campaigns and calculate ROI.
Why We Need Marketing Measurement Dashboards
A marketing dashboard brings together the key measures that we need in order to judge the effectiveness of our digital marketing activity. These measures normally come from a combination of web analytics, like Google Analytics 4 (GA4) and channel analytics (like the analytics we get get from our Email Service Providers or social platforms). These dashboards can then be used to:
- Analyse the effectiveness of our digital campaigns
- Identify areas for further investigation
- Test different combinations of different marketing channels
- See what impact channels are having on one another
Setting Primary Objectives
In order to measure the success of any digital campaign we need to start by deciding what we want people to actually do online. Fill-in a form, buy a product, download a report or watch a video, for example. Our Primary Objective is the closest thing we can get people to do online to our end business objective (however this may still be some way from our end business objective). The easiest way to understand this is using a few examples:
Business to Business:
Our end business objective is a sale of our product or service, but in most cases what we want from our websites is leads. A lead is someone filling in a form or picking up the phone and calling.
Consumer Brand:
Our end business objective is somebody walking into a store or using an online store to buy our product. We may not even own that store or website. In this case my primary objective is engagement with content to build awareness and a desire for that product. So my primary objective will be a defined engagement such as scrolling to the bottom of an article or watching a particular video to the end.
E-Commerce:
Our end business objective is a sale online and our primary objective is a sale online so there is no difference between the two objectives.
Setting Primary Objectives as Analytics Key Events
By understanding what our primary objective is we can then set this up as a goal in our web analytics. In GA4 our goals are known as Key Events. This means we have a direct measure of the success of any digital activity we are carrying out. It’s fundamental at this stage to understand the different type of analytics Key Events and work out how to set these up properly.

Key Events in Google Analytics 4
A key event can be anything from somebody submitting a form, scrolling to the bottom of a particular page, downloading a PDF or watching a particular video to the end. It is essential we set up our desired primary objective as an analytics key event so that we can access reports that let us see the user journey that lead to that conversion, and which of our digital channels and campaigns contributed. Below you will find a complete interactive guide to setting up GA4 Key Events:

Interactive course to help you setup GA4 Key Events
Connecting Primary Objectives to Business Objectives
You may be looking at this so far and seeing some potential problems. How do we know that people filling in a form actually leads to business sales? That’s the next thing we need to consider as we start to build our dashboard.
A enquiry form being filled in is not a sale, and somebody engaging with our content does not mean they are going to buy anything. Therefore our model needs to consider this and we need a way to bridge the gap between business objectives and primary objectives (where these exists). Thankfully this is relatively easy to do in most cases and we will revisit this in more depth later.

Connecting Business Objectives and Primary Objectives

Digital Channels Driving Primary Objectives
The next stage in developing our model is to look at how each channel is driving these primary objectives and what we need to measure for each of these channels. We can now add in digital channels to our model and define the things we measure for these channels as our 'Key Performance Indicators' (KPI) for each channel. The KPIs for each channel will include how much traffic that channel drives to our website, but we will also have a number of other KPIs depending on the channel. These KPIs are all things we could try and improve that will in turn lead to more traffic from the particular channel coming to our website.

Adding Digital Channel Measures to the Model
So for example we can see for the Email Marketing channel, our key indicator is the volume of traffic driven to the site from email marketing. However, we will also be measuring our Open Rate, Click Through Rate (CTR), the number of emails we have sent during the period we are looking at and the number of emails on our email list. These are all our KPIs as these are things we could improve in order to drive more traffic to our website from this particular channel.
For a social channel like X (formally Twitter) we we also look at the volume of traffic sent to our website (or app), but also the number of posts we have made, the average engagement we get per post and the number of followers we have. Again these are identified as our KPIs as they are the key things we can change in order to try and drive more traffic from this channel.
Finally for a paid channel like Google Ads, we again track traffic, but also our average Click Through rate, our budget and the optimisation score that Google gives us. Again these are things that we could try and improve in order to drive more traffic from this channel.
Understanding How Digital Channels Contribute
You may have notice something else that is missing from our framework at this stage? Just because we drive more traffic from a digital channel, whether that is X (formally Twitter), email or anything else, it doesn’t mean that that traffic will convert into our primary objectives being completed. In fact it would be relatively easy to gain lots of followers on a social platform, drive lots of traffic to our site and see no primary objectives completed (because it was the wrong audience and low quality traffic). Therefore we need to build a contribution score into our model that tells us how much that channel has contributed towards our primary goals being completed. Thankfully, because we have setup our primary objectives as conversion events, there is a set of reports that does this for us very easily. These are the attribution modelling reports found under the "Advertising" menu option in GA4.
These attribution modelling reports shows us, of all the people that completed our analytics goals, which channels did they use on the way there (and it can look at this over a period of time, up to 90 days currently). Understanding what this is telling us is really important, and the key point is that the channels it shows are not the last thing somebody did before completing our goal, but one of the things they did. This is important because a journey through to completing a primary goal may include visiting the website many times and coming in from lots of different places. The report looks at each step in the journey and uses something called a Data Driven Attribution Model that utilises machine learning (an application of Artificial Intelligence) to give each step in the journey a weighting score.

GA4 Attribution Modelling in Action
Having this information means that we can now add a contribution percentage to our measurement framework. This means we can then measure, not just how much traffic each channel is driving, but how much this traffic is contributing towards our primary objectives.
Measurement Framework with Channel Contribution Added
The All Channels report from GA4 gives us our contribution scores
This contribution percentage can be taken directly from our attribution modelling reports in GA4 and allows us to look at how effective a particular channel is, but also to look at how this impacts the overall picture of contribution and how channels are interacting together. We can do this in 2 ways:
Raw number:
The 'All Channels Report' simply shows us the total number of conversion events and how many it has attributed to each of our channels. So in the example above it shows a total of 598 conversions. Of these it is attributing 264.82 to organic search. This does not mean that 264.82 people went directly from organic search to complete my conversion event, but rather it's a score that shows the amount that the attribution model believes it has contributed in terms of value. So, for our dashboard we could just show this raw number and then look for changes upward on downward when we review our dashboard.
Percentage:
An alternative approach is to use the numbers the report gives us and calculate a percentage. So in this case we would simply divide 264.82 by 598 to calculate the contribution of organic search. This gives us 44.2%. I am then looking for changes in this percentage when I review my dashboard each time.
Both of these approaches essentially give us the same insights, but often the percentage gives us some context, and can also be easier to communicate to other internal audiences, so is often the preferred approach.
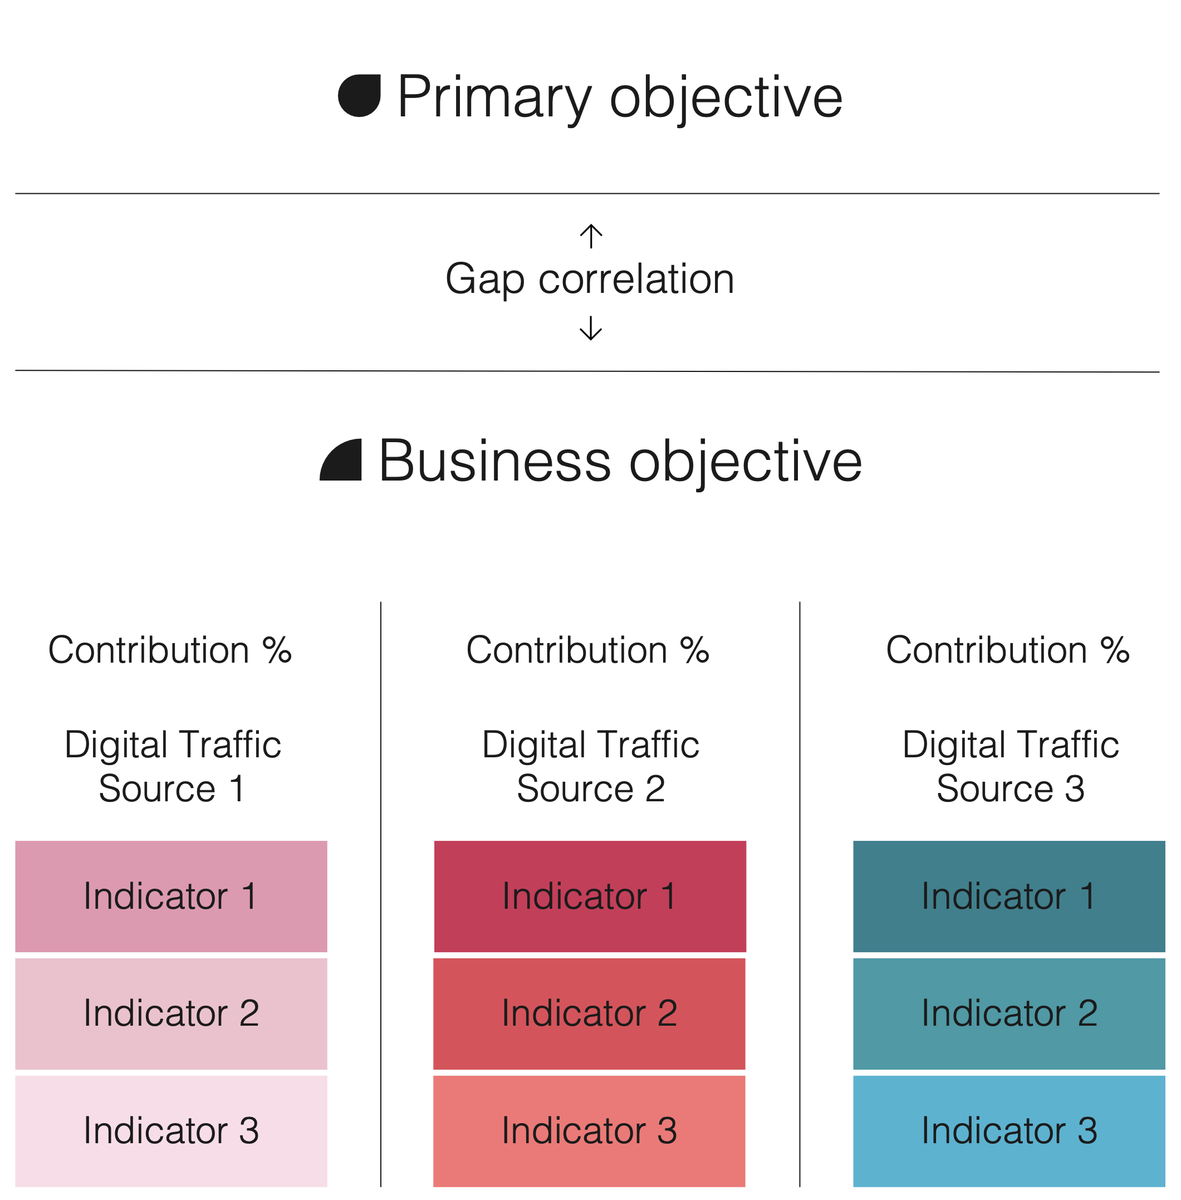
Gap Correlation
One of the final steps in developing our measurement framework is to re-visit the potential gap between Primary Objectives and Business Objectives and try to understand how we can bridge this gap. Essentially there are 3 potential scenarios that we need to consider:
Ecommerce:
There is no gap as Primary and Business objective are the same thing.
Lead/Enquiry Generation:
Our Primary Objective is somebody filling in a form, so we need to track these through to potential sale. This can be done using most Customer Relationship Management (CRM) systems, and CRM systems like Salesforce and Hubspot are geared up to do this easily. We can track the number of lead forms that we have received and then track how many of these have converted into our final business objective (normally a sale).
Branding:
The Primary Objective here is engagement with content because our Business Objective happens on a third-party website, physical location or is a change in behaviour so we can’t track it directly. The gap here can be measured by careful use of sample surveying and questionnaires to understand the correlation between people that complete our Primary Objective an the people that completed our Business Objective. So for example we could add a questionnaire to our product packaging that asks customers that have purchased a product which of our media and digital channels did they use before their purchase. Although not easy, this approach can help bridge gaps in our knowledge that have not been available until now.
Very often however we do not to bridge the gap in these circumstances. Instead we decide that our Primary Objective is a proxy for success. I may feel that more people watching my video to the end will make it more likely they carry out my final Business Objective. It doesn't mean that everyone that completes my Primary Objective will go on to complete my Business Objective, rather that I believe it makes them more likely to. When connecting online metrics to real-world outcomes, often a proxy for success is acceptable.
Very often however we do not to bridge the gap in these circumstances. Instead we decide that our Primary Objective is a proxy for success. I may feel that more people watching my video to the end will make it more likely they carry out my final Business Objective. It doesn't mean that everyone that completes my Primary Objective will go on to complete my Business Objective, rather that I believe it makes them more likely to. When connecting online metrics to real-world outcomes, often a proxy for success is acceptable.
Channel Mix, Tactics Iteration and Testing
The final step in building our measurement framework is to start using it. We can now look at which channels seem to be contributing well or poorly to our objectives. Once we have focussed in on a channel we can look at which indicators we may be able to adjust in order to improve things. This will allow us to develop new tactical campaigns that may, for example, grow our email list, improve our open rate, get us more X (formally Twitter) followers, or improve any of our channel’s indicators. Once we have done this, we can see what impact this has on the channel’s contribution percentage and then continue to iterate through this process.
We should update our dashboard on a regular basis (normally monthly or quarterly) and then review with a group of appropriate stakeholders. We attempt to glean insights, come up with a hypothesis (like posting more regularly might improve things), implement this and then revisit in the next period. I may see that posting more regularly, for example, lead to an increase in contribution of that channel. Any of my indicators changing is interesting, but unless they shift the contribution score for that channel it hasn't really moved the needle. This approach allows us to build an optimum marketing channel mix and keep adjusting it according to changes that happen in the market we are serving.
Conclusions
Although building a Digital Marketing Dashboard is not necessarily easy, it will allow us to effectively build and measure our digital efforts and work through towards understanding the ROI for each of these channels. Once this is achieved it becomes a lot easier to secure and justify more budget and to continue to improve our business results.